
Note: A Site Solver License or the Site Intelligence Add-On is required to activate these layers.

Data Layers
Map data layer overlay information of the following in the canvas:
- USA & Canada Parcels
- Elevation (topography lines in 2D)
- USA FEMA flood zones
- USA Wetlands
- USA Soils
- Zoning
- USA Power Plants
- Major Utilities
- Map & Satellite Views
USA & Canada Parcels
USA and Canada parcel data (provided by Regrid) shows parcel boundaries overlayed on the canvas.
Hovering over a parcel will provide APN & Owner information

Elevation
The elevation toggle shows the topography lines (provided by ESRI) for the site.
The topography line increment can be controlled by using the slider in the Properties Panel.

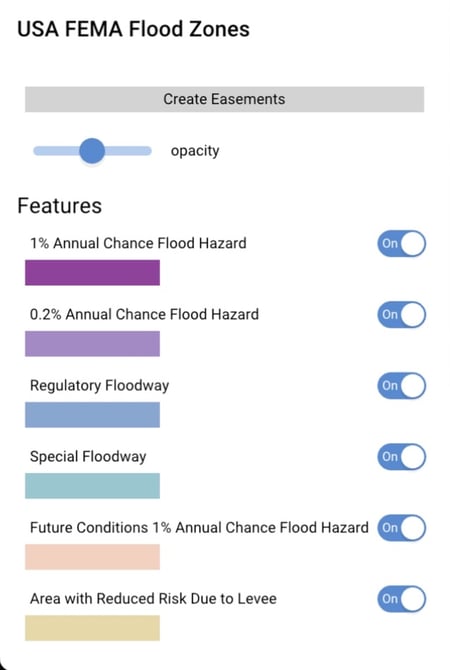
USA FEMA Flood Zones
USA FEMA flood zone information (provided by ESRI) shows the following information, which can be toggled on or off:
- 1% Annual Chance Flood Hazard
- .02% Annual Chance Flood Hazard
- Regulatory Floodway
- Special Floodway
- Future Conditions 1% Annual Chance Flood Hazard
- Area with Reduced Risk Due to Levee
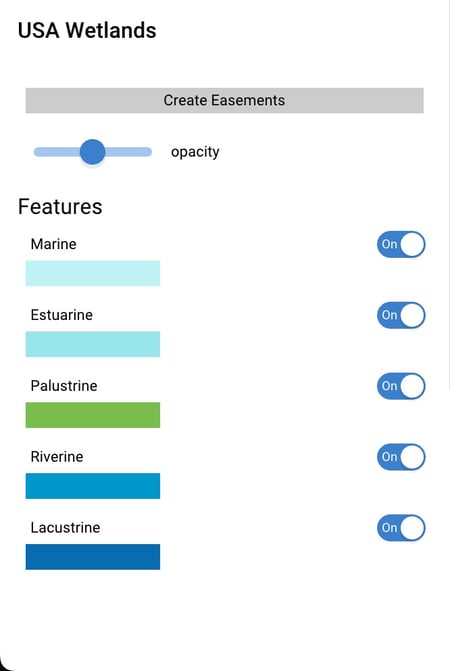
USA Wetlands
USA Wetlands (provided by ESRI) show the following designations:
- Marine
- Estuarine
- Palustrine
- Riverine
- Lacustrine
USA Soils
Soils amp units are provided from the Soil Survey Geographic Database, compiled by the National Resources Conservation Service.

Zoning
Zoning information (provided by Zoneomics) can be overlaid giving you the zoning information per parcel directly in the Canvas.
USA Power Plants
The circle radius represents the Mega Watt (MW) capacity of the powerplant.


Major Utilities
Displays OpenStreetMap infrastructure on major utilities globally. You can Toggle the types of utilities on or off on the left-hand panel. When hovering over a utility line more info will appear in the bottom right of the screen. This will show various information about the line, such as the voltage, the type (telecom/oil/fuel/etc), the provider, etc.


*At this time, Major Utilities does not currently reflect public or private water and sewer data
Map and Satellite views
The canvas can also be displayed using a map or satellite image as the underlay. Satellite views are provided by either:- Google Maps
- ESRI
- Mapbox

Map View

Satellite View

Windrow Information
Similar to the data map information, windrows can be explored in this article